
Paltry Montclair Housing Inventory Continues…
September 10, 2026
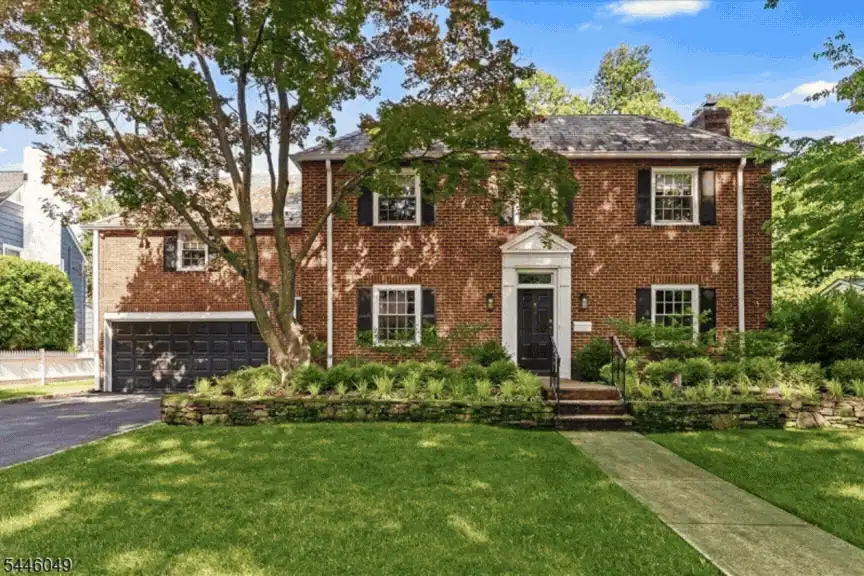
JUST SOLD
4 Marquette Road Montclair
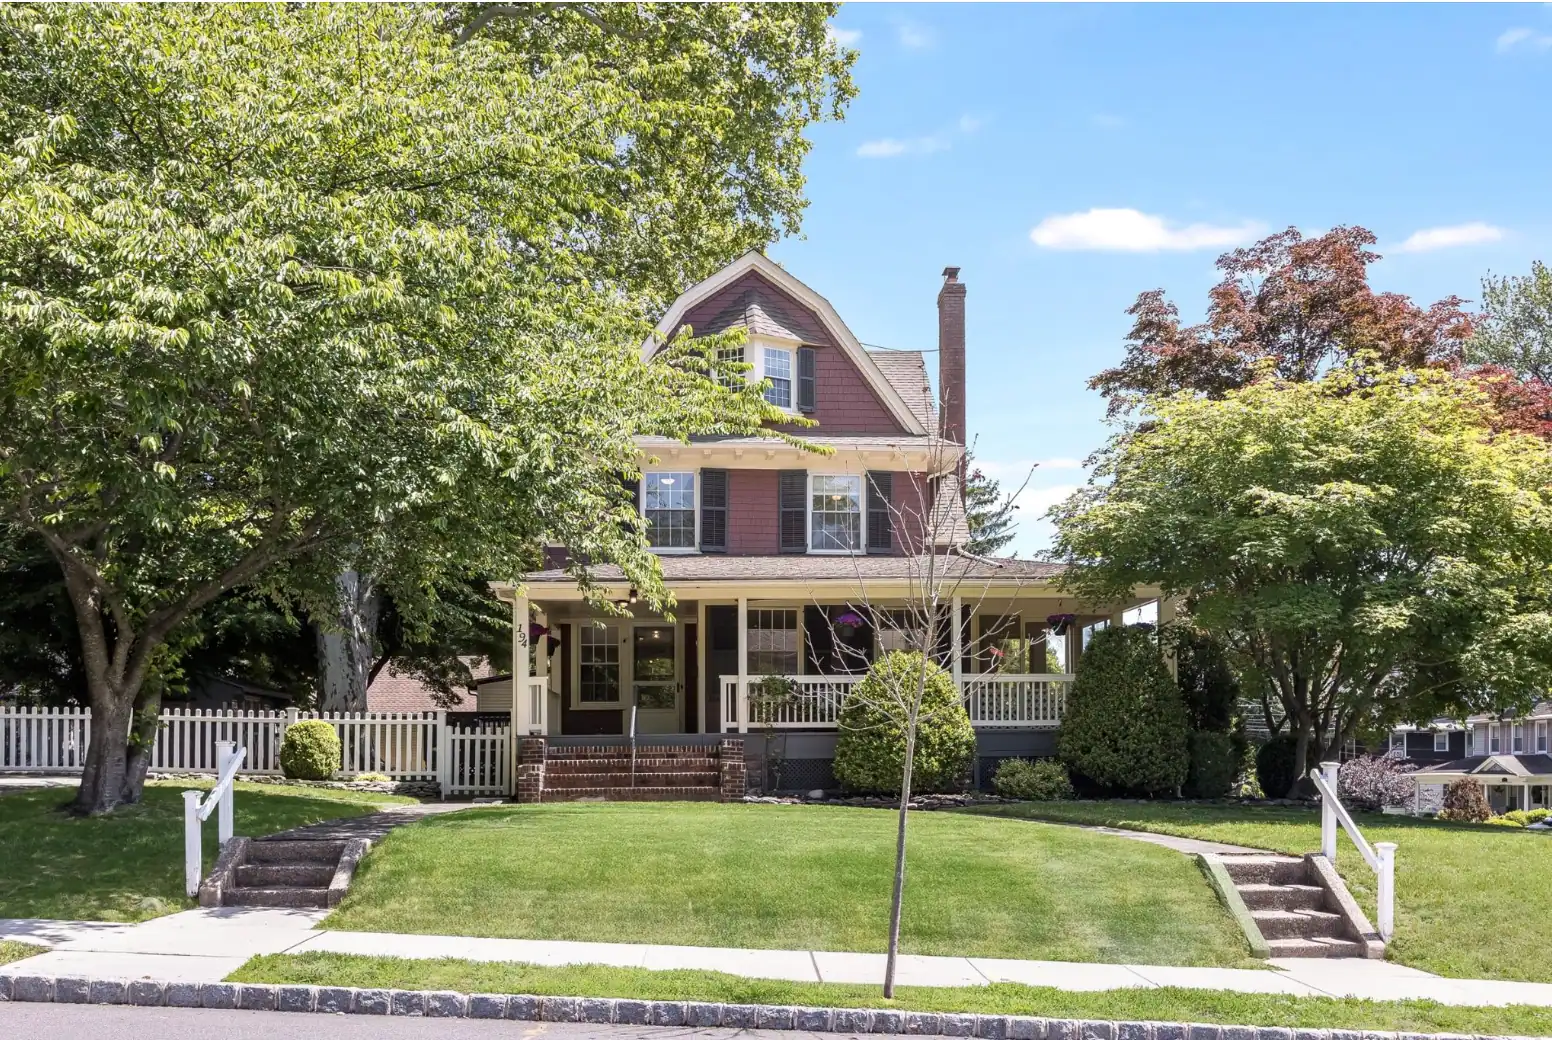
5 Colonial Drive Nutley
Indications that Montclair Real Estate Sellers Market May be Cooling
New inventory continued to track closely with 2025 in September, but available listings rose from 50 to 59 as some houses remained on market. While average sale price grew, a few metrics diverged from last year that may signal a cooling market.
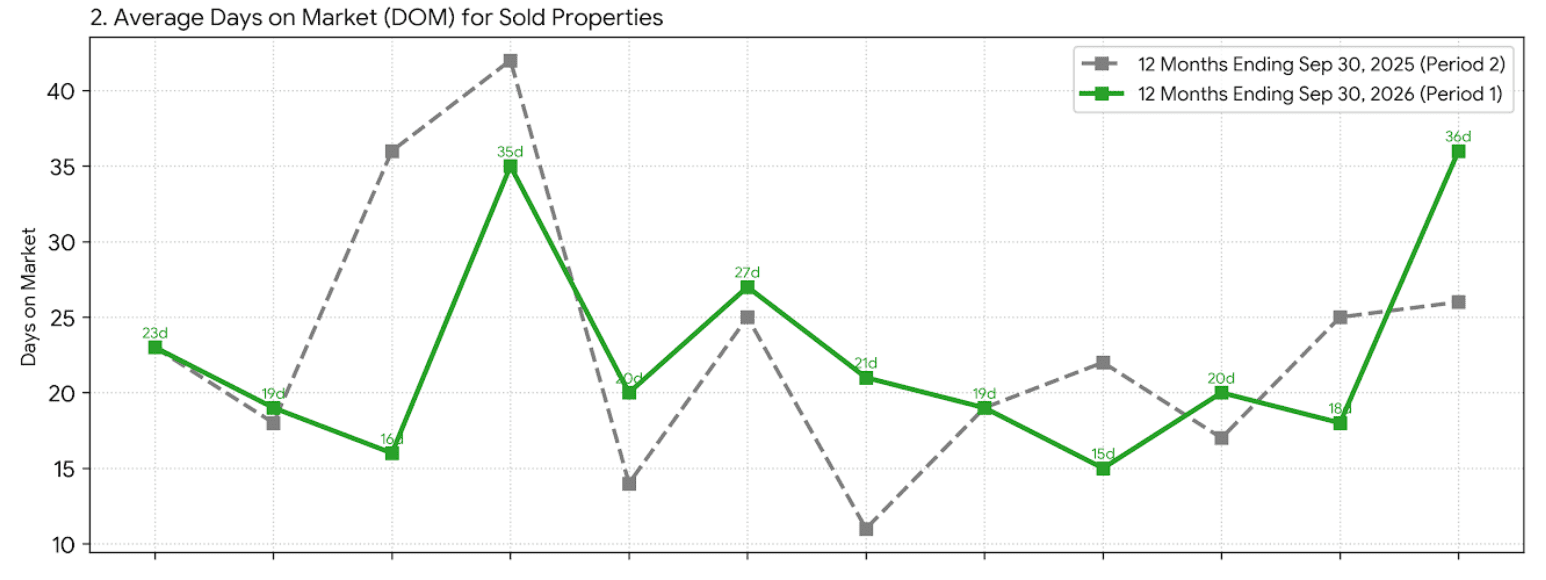
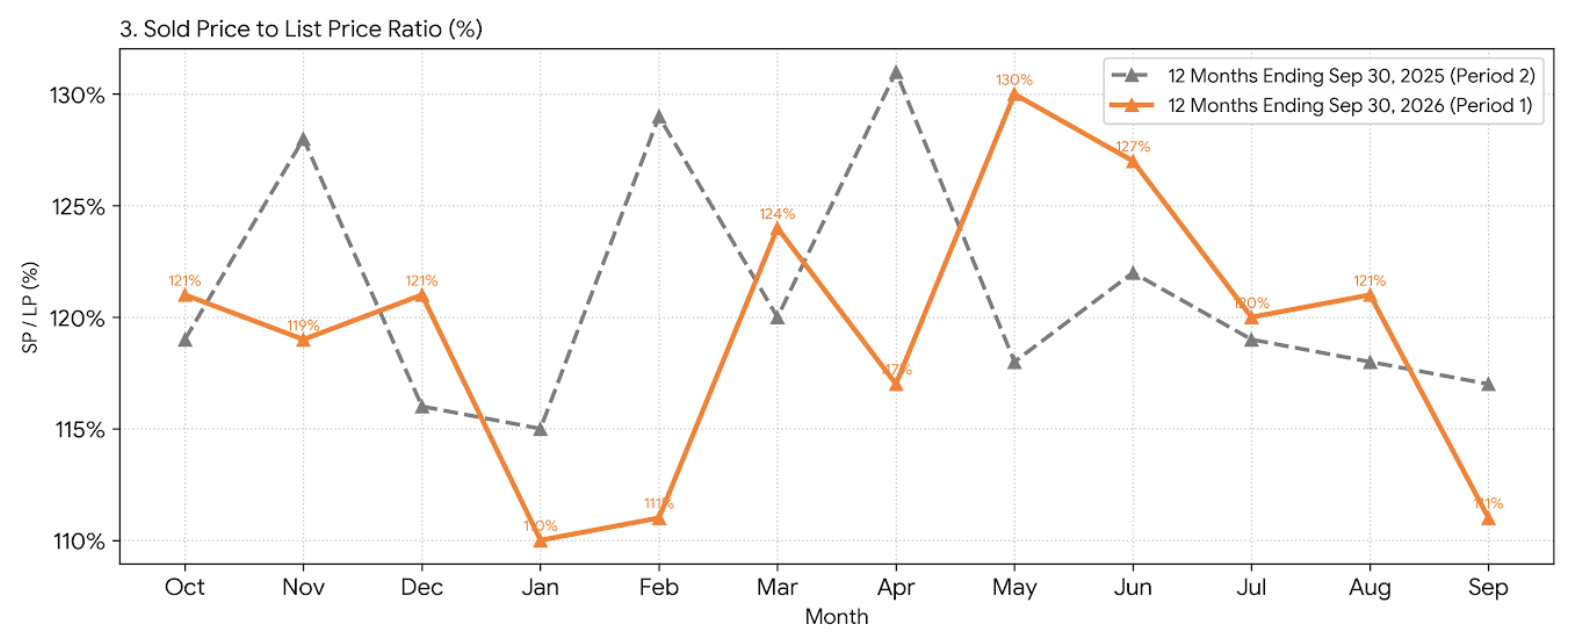
In the figure below you can see that days on market jumped quite a bit while sale price premiums fell to their lowest levels since last winter. October/ November results will be an important indicator of a trend as September closings can reflect an odd mix of homes that were for sale in the typically quiet late summer months.
Montclair, NJ Real Estate Market Analysis: Year-over-year Trajectory
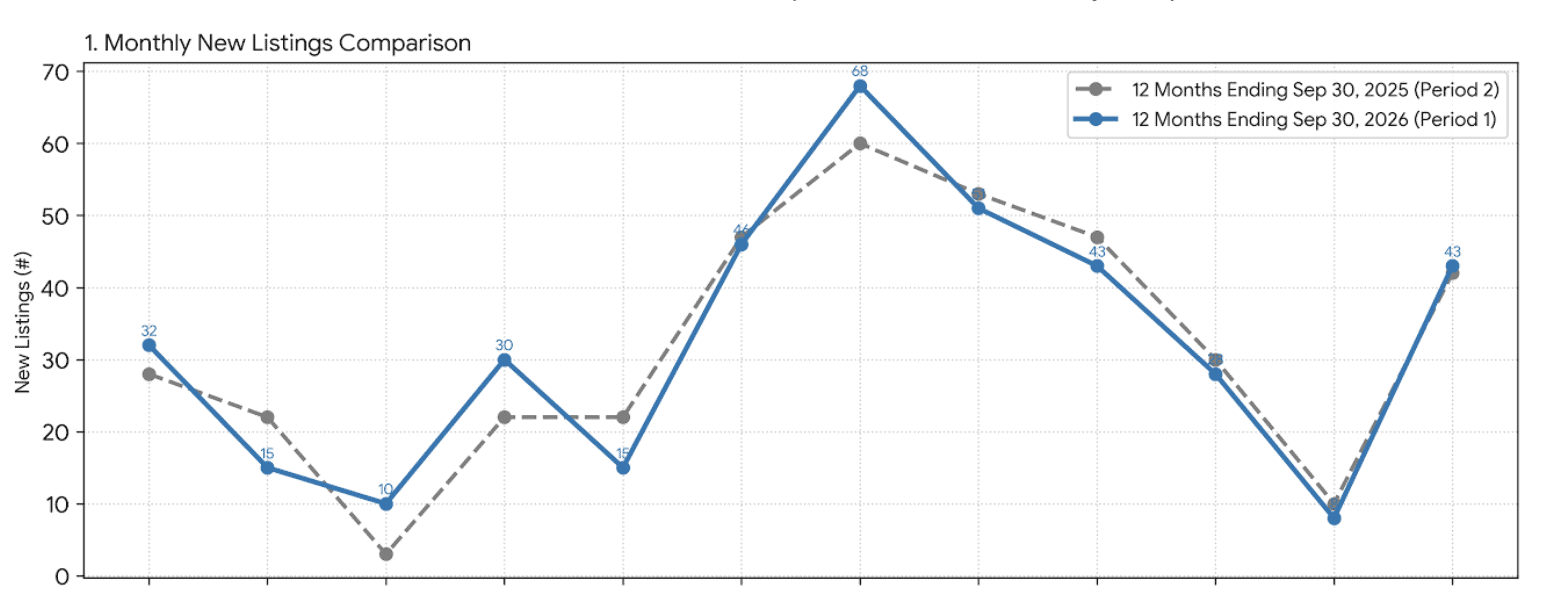
September 2026 marked a pivotal transition month: active inventory expanded by 18.0% YoY (59 active properties vs. 50 in Sep 2025), and average sold price surged 36.3% YoY ($1,243,321 vs. $912,344).
However, average Days on Market for closed sales in September expanded to 36 days, and the Sale Price to List Price (SP/LP) ratio moderated to 111% (down from 117% in Sep 2025), reflecting a more selective buyer pool amidst growing active inventory.
The Montclair, NJ real estate market continued to demonstrate resilient buyer demand and sustained price appreciation over the 12-month period ending September 30, 2026 (Period 1) compared to the prior 12-month period ending September 30, 2025 (Period 2).
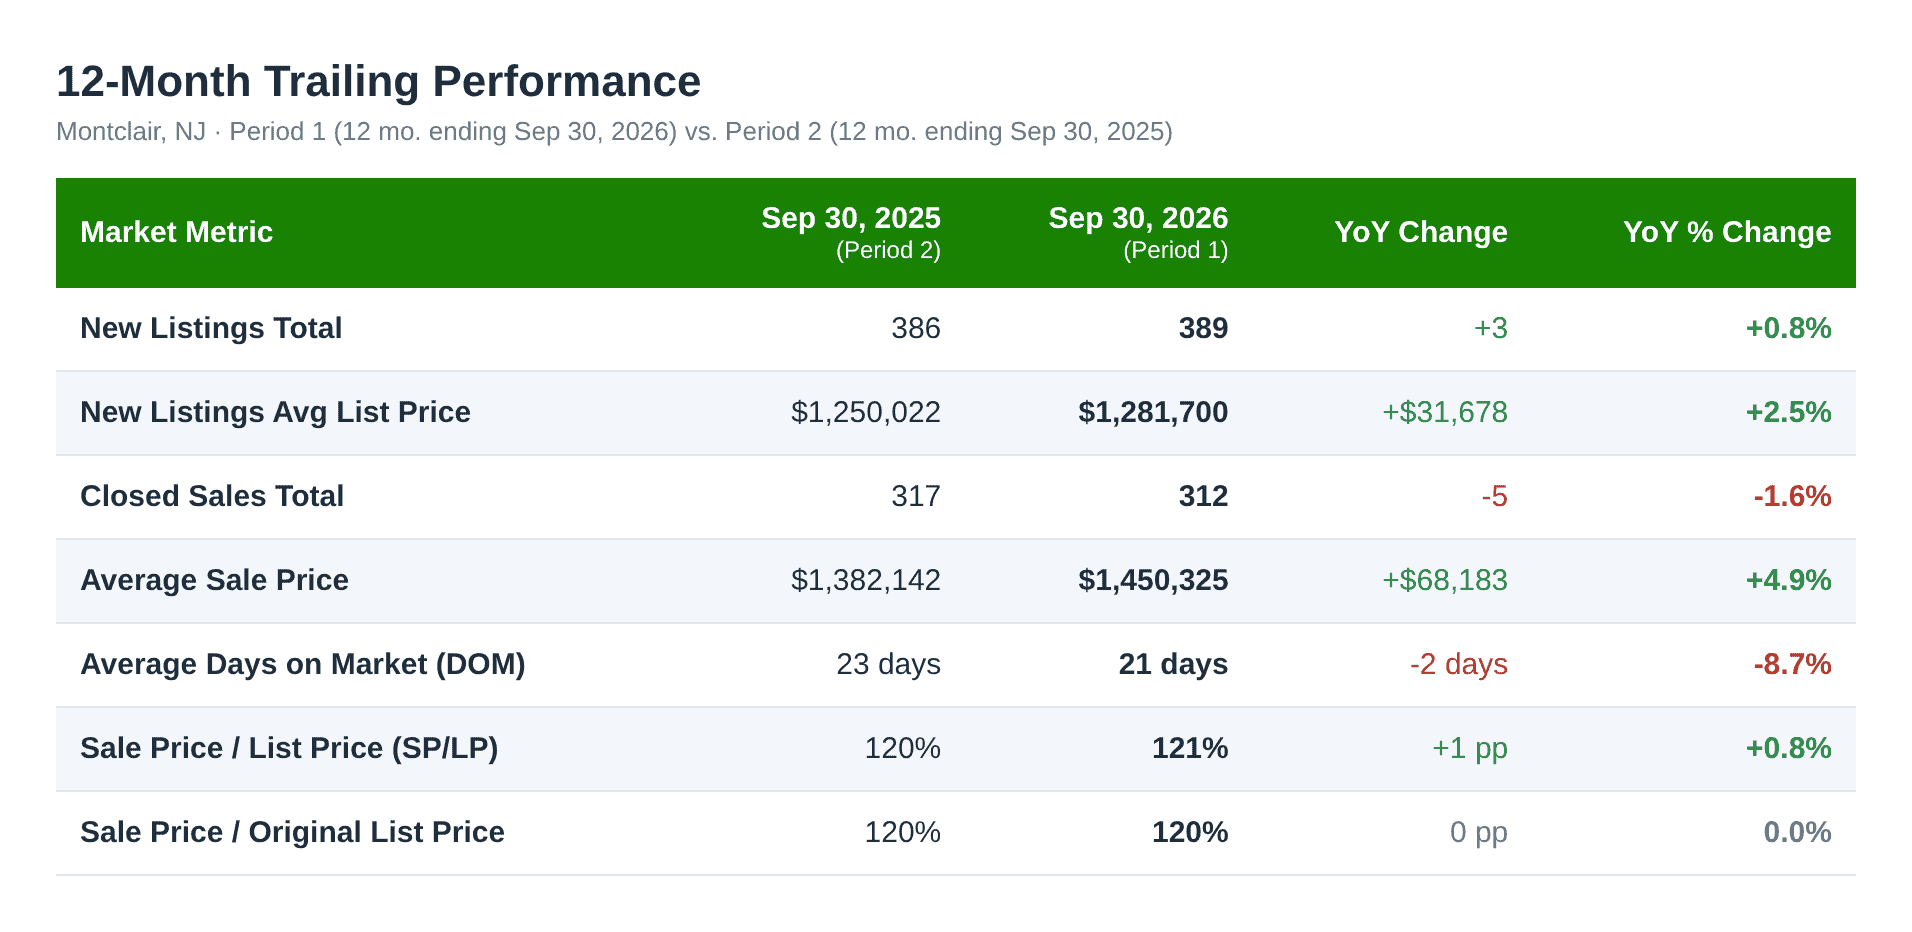
12-Month Trailing Performance (Period 1 vs. Period 2)
While transaction volume experienced a minor moderation, average sold prices increased by 4.9% ($1,450,325 vs. $1,382,142), and properties moved faster overall, with the average Days on Market (DOM) declining from 23 to 21 days.
Key Trailing Insights:
Supply-Demand Balance: New listings remained flat, while total sales saw a slight contraction, indicating supply constraints remain the dominant price driver.
Price Expansion: Home values continued their upward trajectory, growing nearly $68,000 on average year-over-year.
Competitive Bidding: Properties consistently sold above asking price across both 12-month periods, averaging 120%–121% of original listing prices.
September 2026 Focus Analysis vs. September 2025
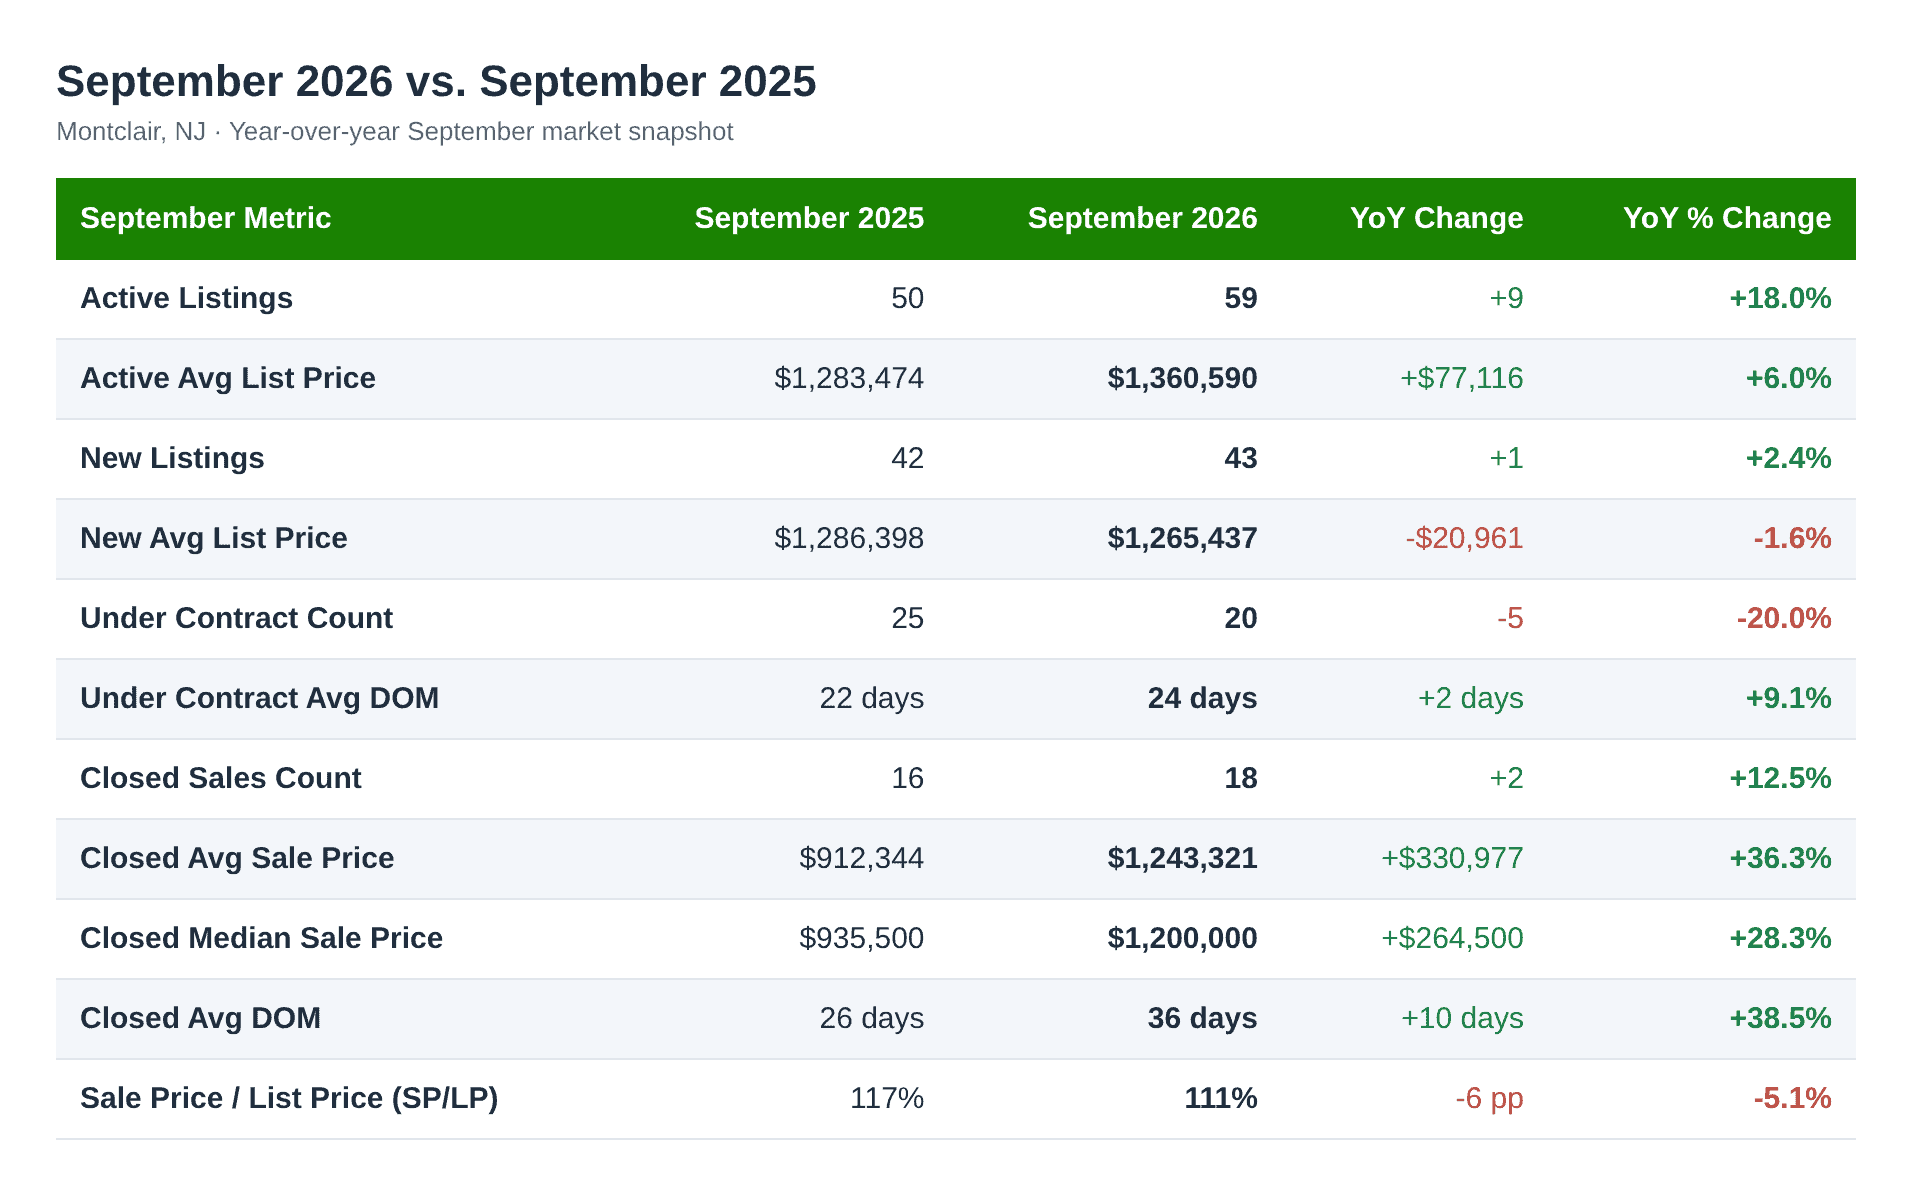
Key September Highlights:
- Significant Price Rebound in Closed Sales: Closed average sale price jumped 36.3% YoY to $1,243,321 (up from $912,344 in September 2025, which saw an unusually lower-priced inventory mix).
- Inventory Expansion: Active listings grew by 18.0% to 59 units, giving buyers slightly more options entering the fall market.
- Days on Market Extension: Average DOM for closed properties rose to 36 days (vs. 26 days in Sep 2025), reflecting higher price sensitivity and longer negotiation cycles.
- Moderating Over-Bidding: The SP/LP ratio softened from 117% to 111%, showing that while homes still sell above list price, premium spreads may be beginning to narrow.
Reach out to me with questions about the local or regional market, investment possibilities, or your home in particular.
I always welcome comments and questions.
We are here to help.
Best, Rich