Opportunistic Home Buying Tips 2018 / Montclair NJ Homes for Sale August 2018 Stanton Recap
September 13, 2018Open Your Business in Montclair NJ
October 29, 2018240 South Mountain Avenue, Montclair, NJ
Montclair NJ Homes for Sale
Recap by Stanton, September 2018
The Hottest Home Market Segments
Montclair home inventory got a boost from 71 new listings in September, raising the amount of active listings to 144 from 124 in August, but staying a good bit lower than the 162 average over the prior 5 Septembers.
Only 27 homes were marked sold in September versus 101 in August and 43 in September last year, which may be indicative of a late summer push this year to get moved in before the school year started.
Is it best to come to market now in an effort to meet Montclair home buyer demand or wait until the big Spring market, albeit with a lot of competing sellers?
The answer depends a lot on price range and the specifics of the home.
Delving deeper into the local real estate market offers insight into what segments have been hottest over the past 12 months and what it means to buyers and sellers.

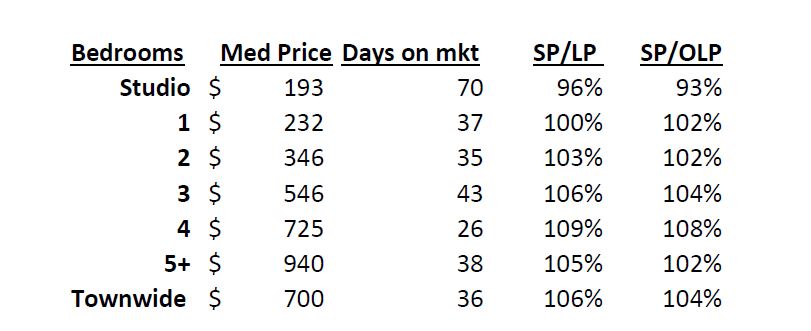
The data above covers the 12 months ended Sept. 30th, 2018.
If you break down the market by home size (and correlated mean sales price), you can see where the “sweet spot” is for demand.
The 4 bedroom segment with a median sales price of $725k was the hottest segment with the shortest days on market at 26 and the highest list price to original list price of 108%.
Another interesting statistic is sale price vs. latest list price compared to sales price vs. original list price, which highlights the difference in the 5+ bedroom segment. The 5+ bedroom segment has the greatest differential, indicating that sellers can anticipate some price reductions in this range.
Do you have questions or would you like further insight and analysis?
Reach out to me to discuss your specific questions.
Best, Rich
(917) 536-8257
PS – Check my previous article for information about June 2018 Montclair NJ Area Real Estate Market results.
